Strategies Guide
Strategies are the brain of TraderTape. A strategy is a structured rule tree that defines:
- When to enter a position (entry rules)
- When to exit a position (exit rules, evaluated in priority order)
- When to add to an existing position (add-on rules, optional)
- How to score signals when more fire than you can take (conviction scoring)
- Configuration — min/max hold, ATR stop multiplier, etc.
This document covers building, cloning, sharing, and managing strategies. For the rule language itself, see Strategy DSL.
Strategies vs models
You'll see two related terms:
- Built-in models (V0–V4) — five reference strategies that ship with TraderTape. They live in code (
strategy_converter.py) and you can't edit them. They're meant to be starting points and benchmarks. - User strategies — your own strategies, stored in the database (
user_strategiestable). You can fork, edit, share, and version them.
Both go through the same DSL interpreter. Both backtest the same way. Both deploy to model portfolios the same way. The only practical difference is who owns the definition.
The strategy lifecycle
Browse / fork template
       ↓
Edit in visual builder
       ↓
Save as draft
       ↓
Backtest against history
       ↓
Iterate (edit → backtest → edit)
       ↓
Deploy to a paper portfolio
       ↓
Validate against live data for a few weeks
       ↓
Deploy to a live portfolio
       ↓
Monitor, refine, version
The visual editor and backtest UI are designed to make this loop fast. A typical iteration cycle is 30–60 seconds: tweak a rule, click Run Backtest, see updated metrics.
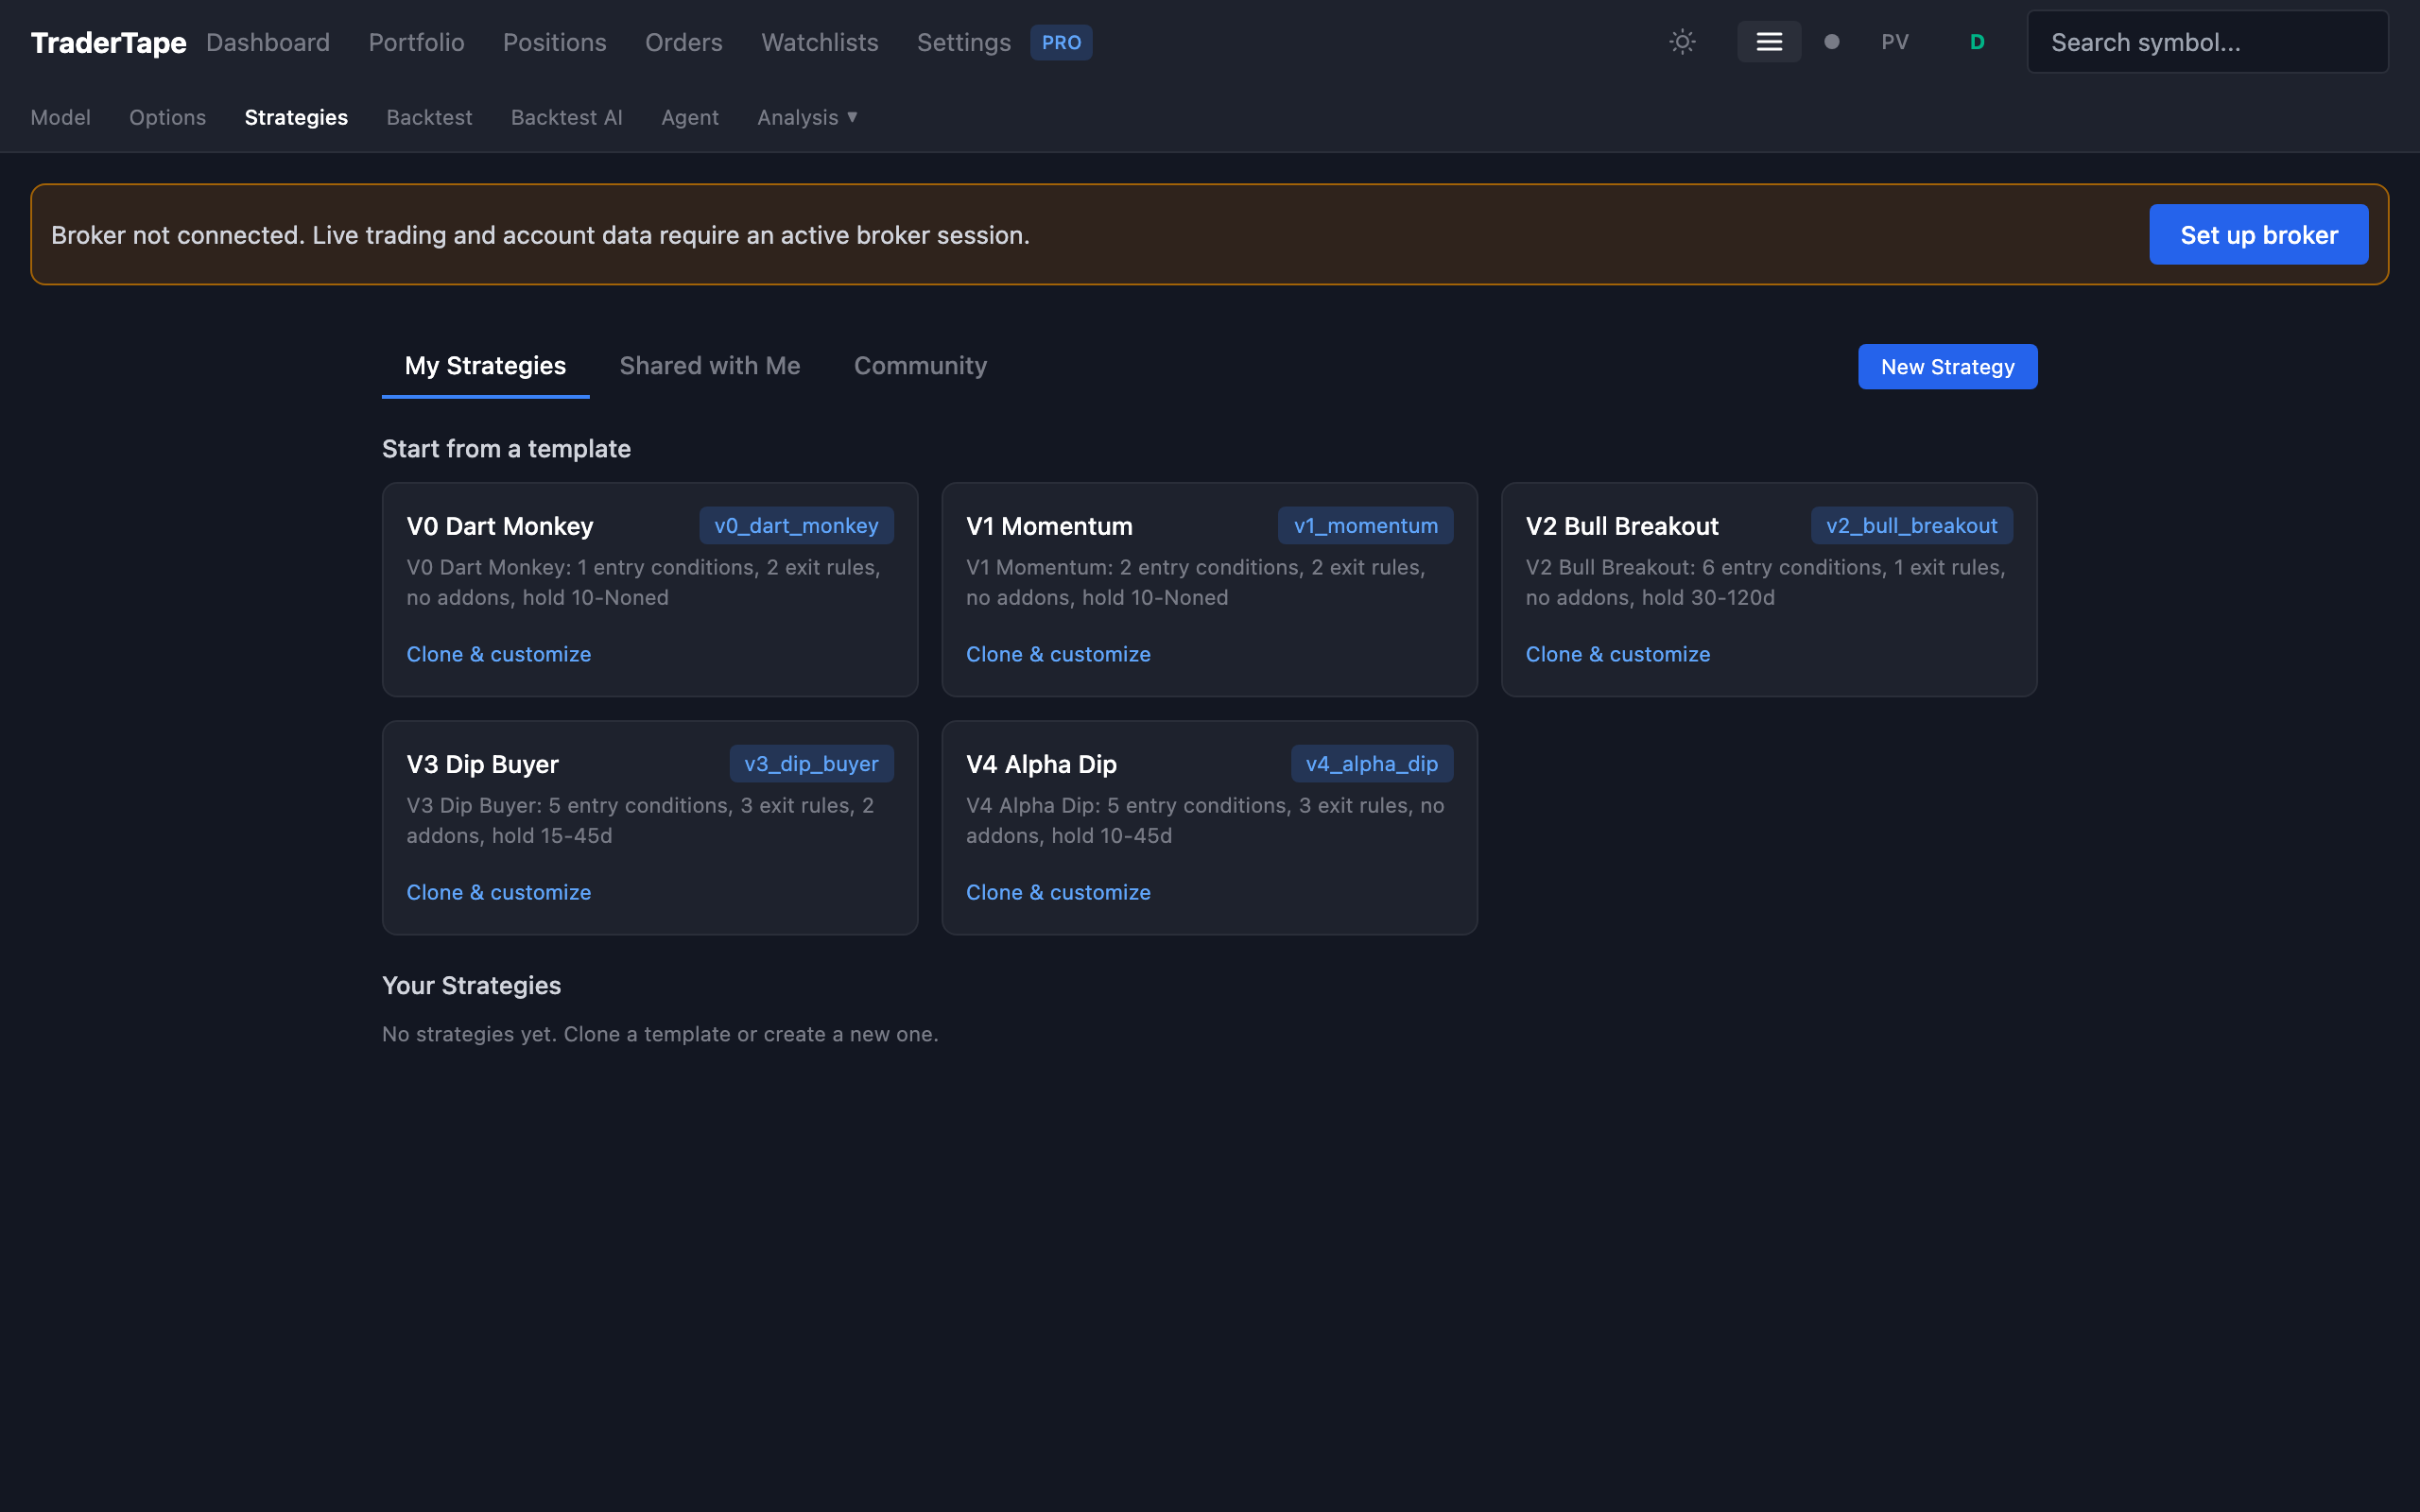
1. Browse strategies
Go to Strategies in the sidebar. You'll see:
- Your strategies — anything you've created or forked
- Templates — starter strategies marked
is_template. Includes the five built-in models in DSL form, plus any community-shared templates - Public strategies — anything other users have shared
For each strategy you'll see:
- Name, base model, version
- Entry / exit / addon rule counts
- Last backtest summary (CAGR, win rate, profit factor)
- Created/updated timestamps
- Fork count (if applicable)
Click any strategy to view its full definition.
2. Create a new strategy
Three options:
Fork a template
Easiest way to start. Pick a built-in (e.g. V3 Dip Buyer) → click Fork. You get a fresh copy under your account that you can edit freely. Forks remember their parent (forked_from), so you can see how your version diverges from the original.
Build from scratch
Click + New Strategy at the top of the Strategies page. You get an empty editor with a blank entry rule tree, no exit rules, and default config.
Use natural language
The strategy chat interface (+ New → Describe in plain English) takes a free-form description and converts it to DSL. Example:
"Buy stocks where RSI is below 30 and price is above the 200-day moving average. Sell when RSI hits 60 or after 30 days, whichever comes first. Use 10% position size."
The chat tool returns a draft DSL strategy you can then edit visually. It's not always perfect — treat it as a first draft, not a finished product.
3. The visual editor
The strategy editor has four sections:
Entry rules
A rule tree where you compose conditions with AND / OR / NOT. Each leaf is one of:
- Compare —
indicator OP valuewhere OP is>,>=,<,<=,== - Near —
indicator within X% of indicator2(used for "price near SMA20") - Always — always true (rare; useful as a placeholder or for "fire on every scan")
Indicators available: RSI, SMA, EMA, ATR, Bollinger Bands (upper/middle/lower), MACD, SuperTrend, Stochastic, ADX, Aroon, CCI, Williams %R, OBV, VWAP, plus context fields like vol_regime, trend_alignment, sector. Periods are configurable (e.g. sma_50, rsi_7).
The editor renders the tree as nested boxes. Click any leaf to edit. Click AND/OR to switch the combinator. Click + to add a sibling.
Exit rules
A list of exit rules, each evaluated in priority order. The first one that matches fires the exit. Each rule has:
- Name — short label for the audit log
- Priority — lower numbers fire first
- Condition — same DSL as entry, but
positionfields liketotal_bars_held,dip_pct,bars_since_last_entryare also available - Exit price — usually
close, can beopen,high,low, or a literal - Ignore min hold — if true, this rule fires even before
min_hold_days(use for emergency stops)
Common exit rules:
RSI > 70(overbought)close < SMA20 AND total_bars_held > 2(trend break with grace period)total_bars_held >= max_hold(forced exit)close > SMA20 AND RSI > 50(recovery exit for dip-buy strategies)
Add-on rules
Optional. Defines averaging-down behaviour. Either disabled or:
enabled— truemax_adds— total number of add-ons allowedmin_dip_pct/max_dip_pct— the dip range from average entry where add-ons firemin_days_between— minimum bars since the last entrycondition— DSL condition that must also be true (e.g. RSI even more oversold than entry)
V3 Dip Buyer is the canonical add-on strategy. V1 / V2 / V4 don't use add-ons.
Conviction scoring
A list of dimensions, each with score buckets. Example for V1 Momentum:
RSI(14):
  60-65 → 40 points
  0-35  → 35 points
  ...

Vol Regime:
  vol_spike    → 18 points
  vol_elevated → 12 points
  ...

SMA20 distance:
  2-3% above → 15 points
  ...

Trend alignment:
  fully_against → 10 points
  ...
The total conviction score is the sum across dimensions, normalized to 0–100. See Conviction Scoring for the philosophy.
Config
Plain key-value:
min_hold— minimum bars before exits can fire (typically 10–30)max_hold— forced exit after this many bars (optional)atr_stop_mult— N × ATR(14) stop. Set to 0 to disable.exit_buffer_pct— small price improvement on exit GTTs
4. Save and version
Strategies have versions. Every save creates a new version (version = N + 1). The previous version is retained — you can see history and roll back.
Versioning is per-strategy, not per-user. If you fork a strategy and edit it, your fork starts at version 1.
Strategies have a is_active flag — disabled strategies don't appear in the deploy modal but their definitions are preserved.
5. Test it: backtest
Click Run Backtest from the strategy detail page. The backtest UI lets you choose:
- Universe — NIFTY 50, NIFTY 100, NIFTY 150, NIFTY 200, NIFTY 500, all traded symbols, or a custom list
- Date range — defaults to "all available data" (~6 years of NIFTY 100 candles)
- Capital — starting capital (default ₹1 Cr)
- Position size — % per trade (default 10%)
- Sector cap — max concurrent in any one sector (default 2)
- Slippage — bps per side (default 5)
- Stops — override the strategy's
atr_stop_multif you want to test "what if I add stops?"
Click Run. The backtest completes in 1–10 seconds depending on the universe size.
You get back:
- CAGR — annualized return
- Win rate — % of trades with positive P&L
- Profit factor — gross profit / gross loss
- Max drawdown — worst portfolio drawdown during the period
- Total trades — count
- Avg holding period — bars
- Per-year breakdown — yearly return + win rate + trade count
- Per-trade detail — every trade with entry/exit dates, P&L, holding period, conviction score
The backtest is realistic — it uses the same DSL interpreter, the same conviction scoring, the same capital constraints, the same slippage assumptions as live trading. A backtest result is what you'd actually achieve if you'd run the strategy historically.
The detail view is where the real insight comes from. Sort by P&L, look at the worst trades, look at what they had in common (RSI, vol regime, sector), and tighten the entry rules to filter them out. This is the iteration loop that makes strategies good.
6. Deploy
When you're happy with the backtest, click Deploy from the strategy detail page (or go to Model Trading and pick the strategy in the deploy modal).
Always start with a paper portfolio. Run it for at least a couple of weeks. Compare the live results to the backtest results — if they diverge significantly, something's wrong (usually candle data freshness, look-ahead bias in the strategy, or a mismatch between backtest universe and live scan universe).
Once paper looks consistent, deploy live with a small capital allocation. Scale up as confidence grows.
7. Share and fork
If you mark a strategy is_public, it appears in the public Strategies tab where other users can view and fork it. Your name is shown as the author.
Forks are tracked: every fork increments the parent's fork_count, and the fork's forked_from field points back to the parent. This lets you see derivative strategies and (if you want) follow up on what people are doing with your work.
Sharing is opt-in and reversible — toggle is_public to false to remove a strategy from the public view.
8. The DSL under the hood
When you save a strategy in the visual editor, the system stores the rule tree as JSON in the user_strategies table:
{
  "name": "My Dip Buyer",
  "base_model": "v3_dip_buyer",
  "entry_rules": {
    "type": "and",
    "conditions": [
      {"type": "compare", "left": {"type": "indicator", "name": "rsi14"}, "op": "<=", "right": {"type": "literal", "value": 45}},
      ...
    ]
  },
  "exit_rules": [...],
  "addon_rules": {...},
  "conviction_scoring": [...],
  "config": {...}
}
You can edit this JSON directly via the API if you prefer, but the visual editor is the recommended path. See Strategy DSL for the full schema.
9. Strategy chat (LLM assistant)
The Strategies page has a chat interface that lets you ask questions like:
- "Why does this strategy lose money in Q2 2022?"
- "What if I add a vol_spike filter?"
- "Compare this to V3 Dip Buyer"
The chat tool has access to the strategy definition, the most recent backtest results, and a set of analysis tools. It won't autonomously modify your strategy — it suggests changes, you click to apply them.
This is useful for quick experimentation when you don't know exactly which knob to turn. Treat it as a research assistant, not an oracle.
Common patterns
"My strategy fires too few signals"
- Loosen entry conditions one at a time, re-running the backtest each time
- Check the rejection log — every entry that almost matched is logged with the failing condition. Sort by frequency to see what's blocking you.
- Consider widening the universe (NIFTY 100 → NIFTY 200) for more candidates
"Backtest says CAGR 30% but live is flat"
The most common causes:
- Candle freshness — the backtest uses clean EOD data; live uses whatever was in the candle store when the scan ran. The cloud refreshes candles automatically each evening, but if you're seeing systematic divergence, check the data coverage panel in Settings.
- Look-ahead bias — your strategy uses
closefor the entry decision, butcloseis only known at end-of-day, while live signals fire on the most recent close which may include partial data. Useprev_closeif you need to be strict. - Manual interventions — you rejected signals the model wanted. Check the Compliance tab for the gap.
- Scan timing — backtests scan every bar; live only scans once a day. Multi-day setups should be identical, but signals that fire on intraday extremes will differ.
"I want to use a custom indicator"
The DSL has 17 built-in indicators with configurable periods. If you need something else (RSI on VWAP, custom oscillators, etc.), there's currently no way to define new indicators purely from the UI — that's on the roadmap. Email support if you have a specific indicator request and we'll consider adding it natively.
Reference
- Strategy DSL — full DSL syntax, indicator list, condition types
- Built-in Models — V0–V4 explained
- Backtesting Guide — running backtests, interpreting results
- Conviction Scoring — the scoring system in detail