Backtesting Guide
A backtest replays a strategy against historical market data to estimate how it would have performed. TraderTape's backtester is realistic — it uses the same DSL interpreter, the same conviction scoring, the same capital constraints, the same slippage model as live trading. A backtest result is what you'd actually achieve if you'd been running the strategy historically.
This guide covers running backtests, interpreting results, and avoiding the common ways backtests lie.
How the backtester works
The backtester is a day-by-day event loop. For each trading day in the date range:
- Fetch the day's bar (OHLC + volume) for every symbol in the universe
- Compute indicators on the running candle history (no look-ahead)
- Evaluate exit rules on every open position
- Evaluate add-on rules on every open position
- Evaluate entry rules on every symbol in the universe
- Score new entry signals via conviction scoring
- Allocate capital: rank by conviction, fill in order until capital or position-count caps are hit
- Apply ATR stops on intraday lows (if configured)
- Apply gap-down forced exits (if configured)
- Update portfolio state (capital, positions, P&L, audit log)
The loop runs day by day so the simulator never sees the future. Indicators are computed using only candles up to and including the current bar. Capital constraints are enforced exactly as they would be live.
A 6-year backtest of NIFTY 100 with daily bars typically completes in 2–8 seconds.
Running a backtest
Two paths:
From the Strategies page
Click Run Backtest on any strategy. A modal opens with the standard config knobs. Click Run. Results display inline.
From the Backtest page
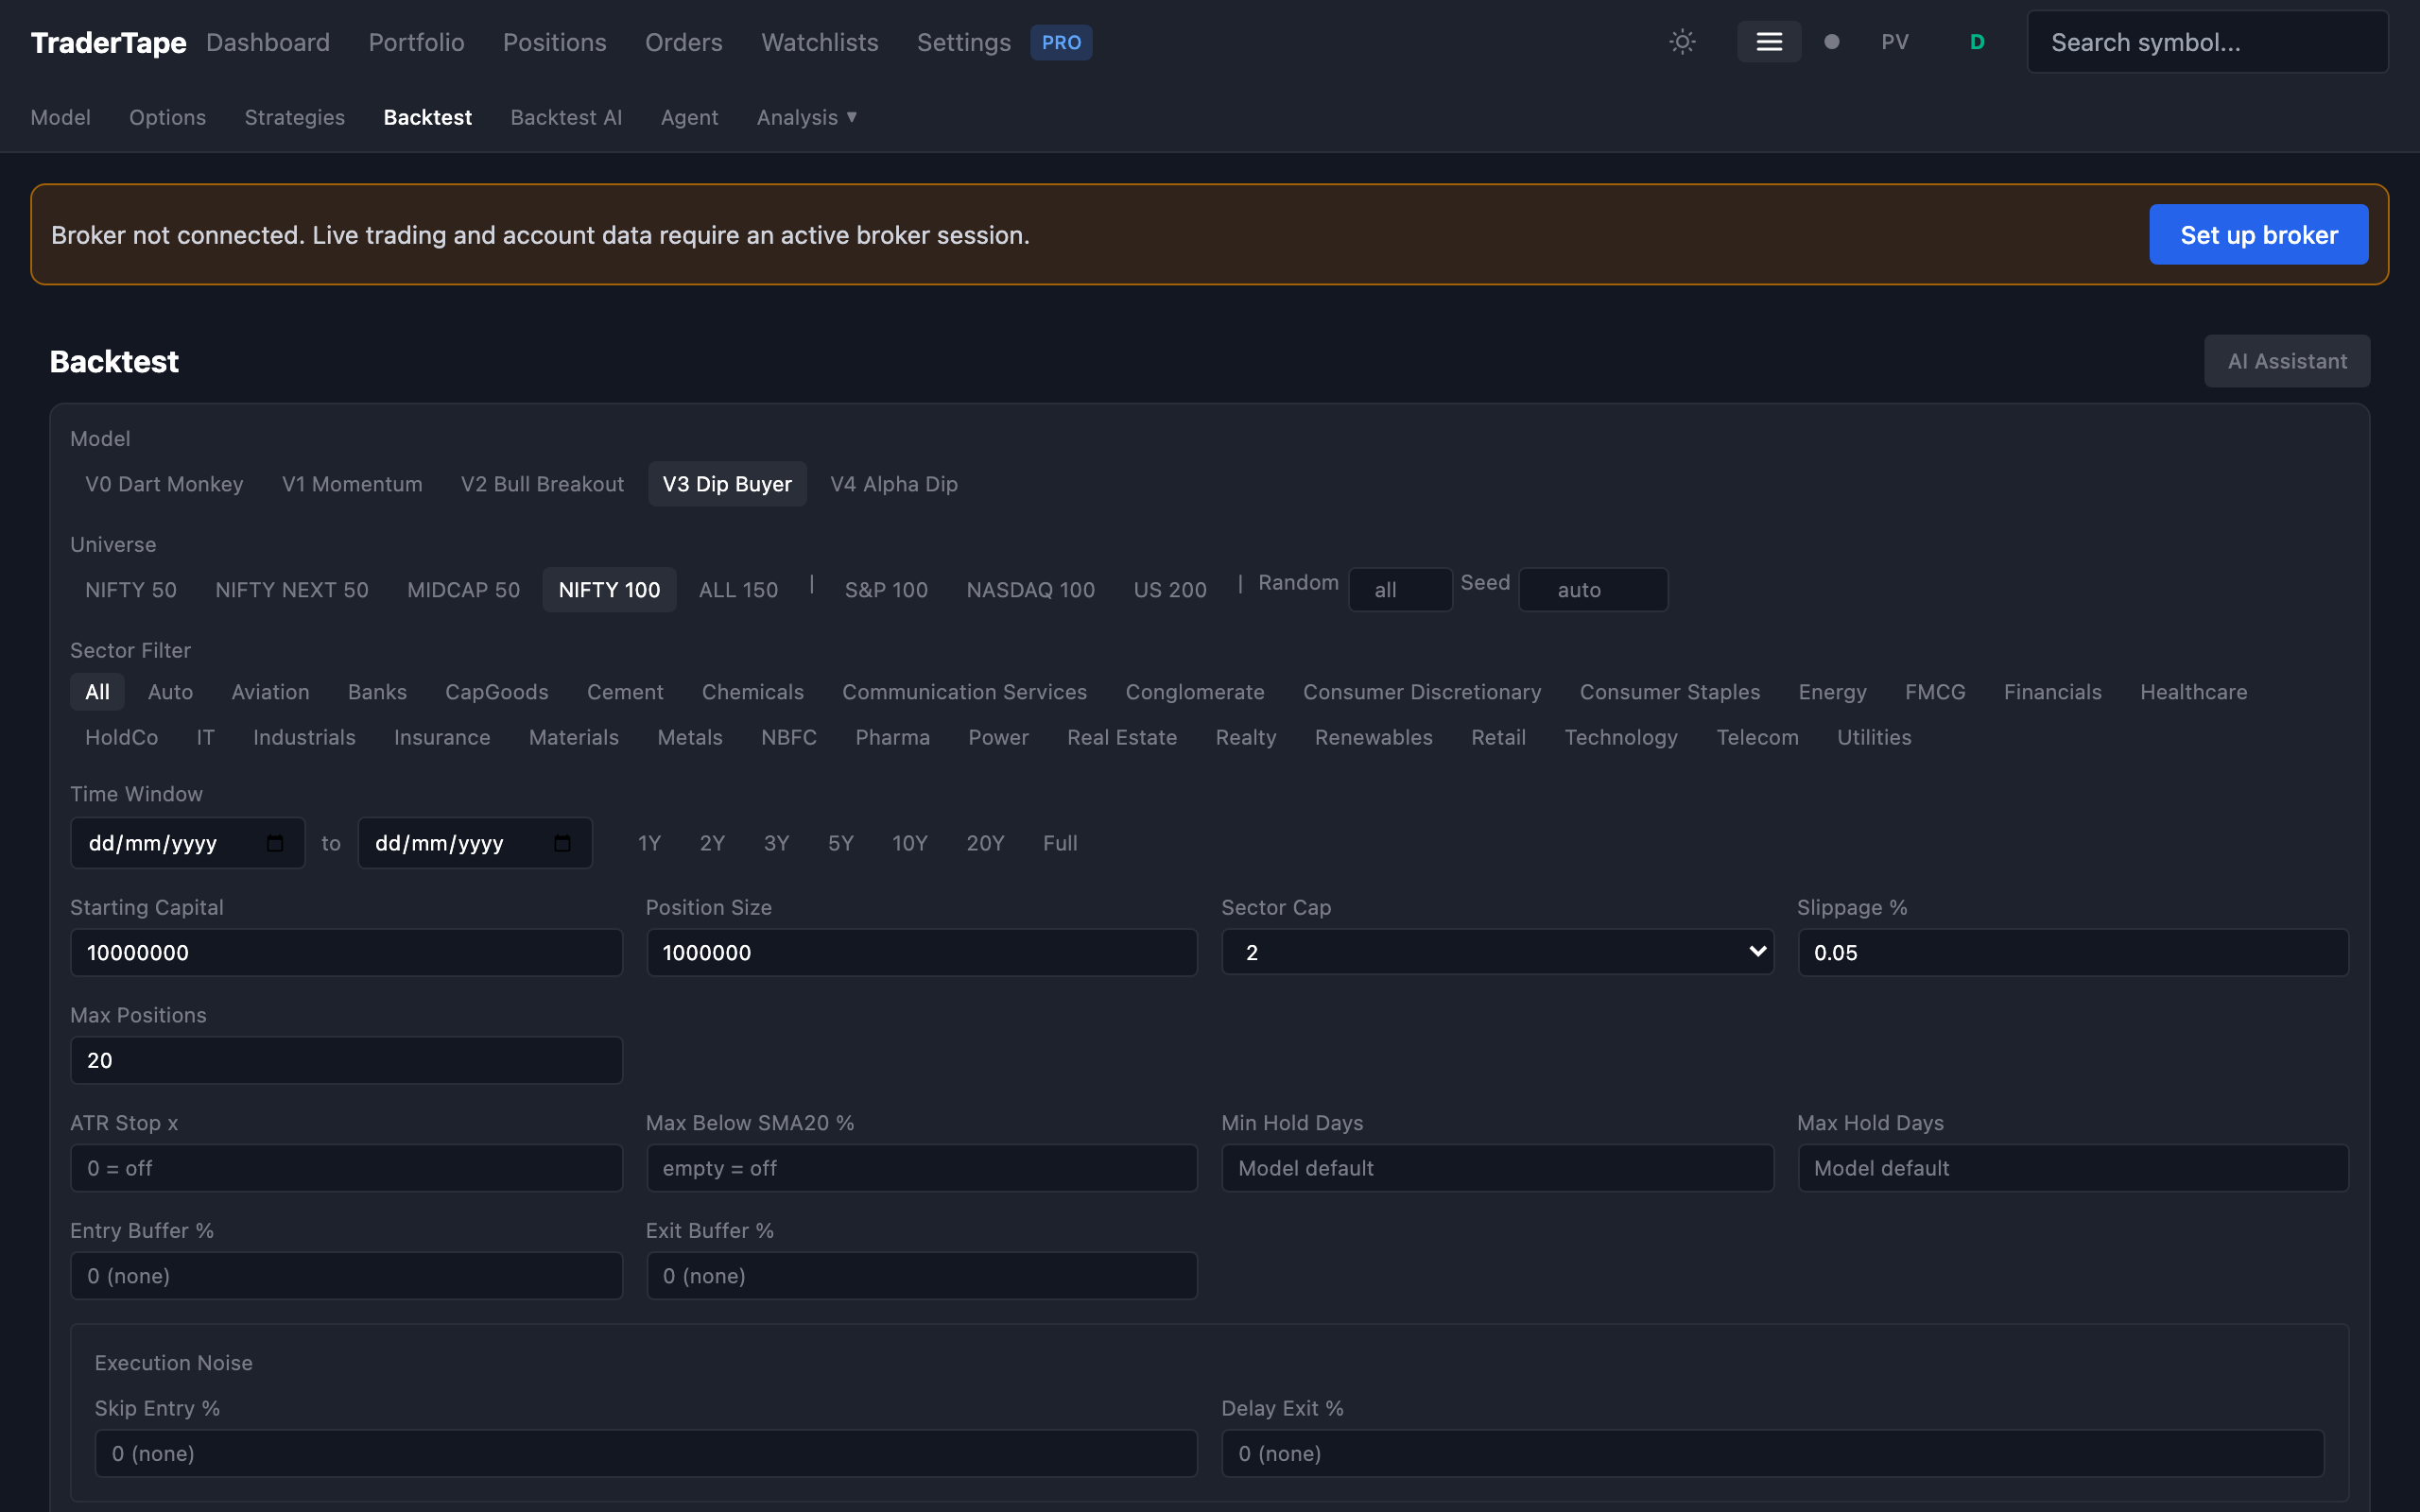
The Backtest page (sidebar → Backtest) lets you queue multiple runs, compare them side by side, and persist them in the backtest history. Use this when you want to A/B test variants of the same strategy or compare different strategies on the same universe.
Configuration
Every backtest takes:
Strategy — pick from your strategies + built-in models.
Universe — which stocks to consider:
- NIFTY 50 — large caps only (50 stocks)
- NIFTY NEXT 50 — second tier (50 stocks)
- NIFTY 100 — combined (the default for most testing)
- NIFTY 150 — adds NIFTY MIDCAP 50
- NIFTY 200 — adds NEXT 100
- NIFTY 500 — full set
- All traded — every symbol you've ever traded (uses your tradebook history)
- Custom — paste a comma-separated symbol list
The universe affects both the signal pool and the survivorship-bias correction. If you pick NIFTY 100, the backtester uses the historical NIFTY 100 constituents on each date — so a stock that joined NIFTY 100 in 2022 doesn't get tested on 2018 data.
Date range — defaults to "all available data". Earliest is bounded by your candle table coverage (typically 2018-01-01).
Starting capital — default ₹1 Cr.
Position size — position_size_pct of starting capital. Default 10% (₹10L per trade on ₹1 Cr).
Max positions — concurrent open positions cap. Default 20.
Max per sector — concurrent positions in any one sector. Default 2.
Slippage — basis points per side. Default 5 bps (0.05%) per side, matching the realistic backtest model. Set to 0 for an idealized run.
Stop loss override — use the strategy's atr_stop_mult, or override with a custom value. Useful for testing "what if I add stops?" without editing the strategy.
Min hold override — same idea, override the strategy's min_hold config.
Reading the results
The result page shows summary metrics, per-year breakdown, per-trade detail, and a strategy rules dump so you can verify what was actually run.
Summary metrics
CAGR             30.0%       Annualized return over the period
Total P&L        +5.31 Cr    Absolute return
Win Rate         45.1%       % of trades with positive realized P&L
Profit Factor    1.56        Gross profit / gross loss
Max DD           -22.1%      Worst portfolio drawdown
Total Trades     3,448       Trade count
Avg Hold         21d         Mean holding period
Final Capital    ₹6.31 Cr    What you'd end with
The metrics that matter most depend on the strategy:
- CAGR — for buy-and-hold-style strategies, this is the main number
- Profit factor — for high-frequency strategies, PF > 1.5 means there's real edge
- Win rate × avg P&L per trade — combine these. A 45% WR with +1.25% avg per trade is much better than 60% WR with +0.5%
- Max DD — the drawdown you'd actually have to sit through. If this is bigger than your tolerance, the strategy is wrong for you regardless of CAGR
- Avg hold — tells you whether the strategy is short-term (<10d), medium (10-30d), or long (>30d). Affects taxes (STCG vs LTCG), capital turnover, and operational overhead
Per-year breakdown
| Year | Trades | WR | Avg P&L | P&L | Best | Worst |
|---|---|---|---|---|---|---|
| 2021 | 328 | 42.7% | +0.51% | +64.4L | +18.2% | -8.4% |
| 2022 | 597 | 47.6% | +1.04% | +76.0L | +22.1% | -12.7% |
| 2023 | 640 | 53.8% | +2.94% | +1.88 Cr | +24.5% | -15.2% |
| 2024 | 633 | 44.5% | +1.21% | +76.6L | +19.8% | -18.3% |
| 2025 | 1097 | 38.6% | +0.17% | +19.1L | +14.7% | -22.5% |
This is the most useful sanity check: does the strategy work in all market regimes or only in bull markets?
If you see one year with massive returns and the rest flat, the strategy is over-fit to that year's conditions and probably won't generalize. A good strategy is consistently positive across years, even if the magnitude varies.
Per-trade detail
Every trade in the backtest, with:
- Entry date / price / qty / sector / conviction
- Exit date / price / reason / P&L / P&L%
- Holding period
- Indicator snapshot at entry
Sort by P&L to see the best and worst trades. Look at the worst 10:
- Are they all in one sector? (Sector cap might be too loose)
- Are they all in vol_spike conditions? (Tighten the entry filter)
- Are they all early-exits via stop loss? (Maybe your stop is too tight)
This is where you find the edges of your strategy.
Holding period analysis
Most strategies have a sweet spot for holding period. Look at:
0-3 days   → 42% WR, -0.51% avg
4-7 days   → 22% WR, -0.96% avg   ← worst bucket
8-14 days  → 35% WR, +0.63% avg
15-21 days → 54% WR, +2.60% avg
22-30 days → 82% WR, +4.62% avg
> 30 days  → 98% WR, +7.72% avg   ← all the alpha
If most of your trades exit in the bad buckets, your exit rules are firing too early. Increase min_hold_days or weaken the exit conditions.
Conviction quintile analysis
The backtest sorts entry signals by conviction and groups them into quintiles (Q1 = lowest conviction, Q5 = highest). For each quintile, it shows the win rate and avg P&L. A working conviction model has a monotonic curve: Q1 < Q2 < Q3 < Q4 < Q5.
If your scoring is uncorrelated with outcome, all quintiles look the same. If it's inverted (high conviction = worse outcomes), the scoring is wrong — invert the dimensions or rebuild it.
This analysis is what drove the V1 conviction scoring research in 2026 (the "rsi_dominant" scoring variant): the original textbook scoring was almost perfectly inverted from what the data showed.
Common backtest pitfalls
Look-ahead bias
The most common backtest error: using data that wouldn't have been available on the entry date. Examples:
- Using closing price as the entry trigger when the actual entry would have been next-day open
- Using indicators computed on the full dataset instead of the rolling window
- Using corporate-action-adjusted prices for trades before the corporate action
The TraderTape backtester is designed to avoid look-ahead, but custom strategies can introduce it. If your backtest CAGR is wildly above market returns (e.g. 60%+ on NIFTY 100), suspect look-ahead first.
Survivorship bias
Backtesting on the current NIFTY 50 constituents, not the historical ones. Stocks that fell out of the index (because they went bankrupt or got demerged) are missing, so the backtest only sees the survivors.
The TraderTape backtester uses historical index constituents on each date when running against a NIFTY 50 / NIFTY 100 / NIFTY 200 universe. This corrects for survivorship bias automatically — you don't need to do anything.
Optimization bias (over-fitting)
Tuning the strategy until the backtest looks great. The more parameters you tweak, the more likely you've fit the noise of the historical data.
Defenses:
- Walk-forward testing — backtest on 2018-2023, validate on 2024-2026 unseen
- Yearly breakdown — if performance is concentrated in one year, you're probably over-fit
- Cross-universe — if a strategy works on NIFTY 100 but not on NIFTY 200, it's exploiting universe-specific patterns
- Reduce parameter count — strategies with 3 entry conditions generalize better than ones with 10
Slippage and costs
The default 5 bps slippage per side is realistic for liquid NIFTY 100 stocks. For mid- and small-caps, real slippage can be 20–50 bps. Brokerage, STT, GST, and exchange fees add another 0.1–0.2% per round trip — these are not modeled by the backtest.
For a "true" P&L estimate, mentally subtract 0.2-0.5% per round trip from the backtest results.
Comparing backtests
The Backtest history page shows your past runs with summary metrics. Click two runs to compare side by side:
- Same strategy, different config (e.g. with vs without ATR stops)
- Same config, different strategies
- Same strategy + config, different date ranges
The comparison view highlights where the runs differ — useful for ablation studies.
Saving runs
Every backtest is persisted in backtest_runs with the full config snapshot, so you can return to it later. You don't need to re-run anything.
This is important for reproducibility: when a strategy goes live, the saved backtest is the baseline you compare actual performance against. The Compliance tab on the live portfolio reads from this saved run.
What about FO / options backtests?
The current backtester supports EQ delivery only (CNC). There's no FO/options backtesting in TraderTape — the corporate action handling, physical delivery accounting, and option settlement logic exists in the analysis pipeline (for tradebook P&L), but the backtester is EQ-only.
If you need to test an FO strategy, the recommended path is:
- Express the strategy on the underlying (EQ) symbol
- Backtest the underlying
- Translate the entry/exit timing to FO contracts manually
This is a known limitation. FO backtesting is on the roadmap.
Next
- Strategies Guide — building strategies that backtest well
- Strategy DSL — the rule language
- Conviction Scoring — scoring philosophy
- Built-in Models — V0–V4 backtested numbers