Journal
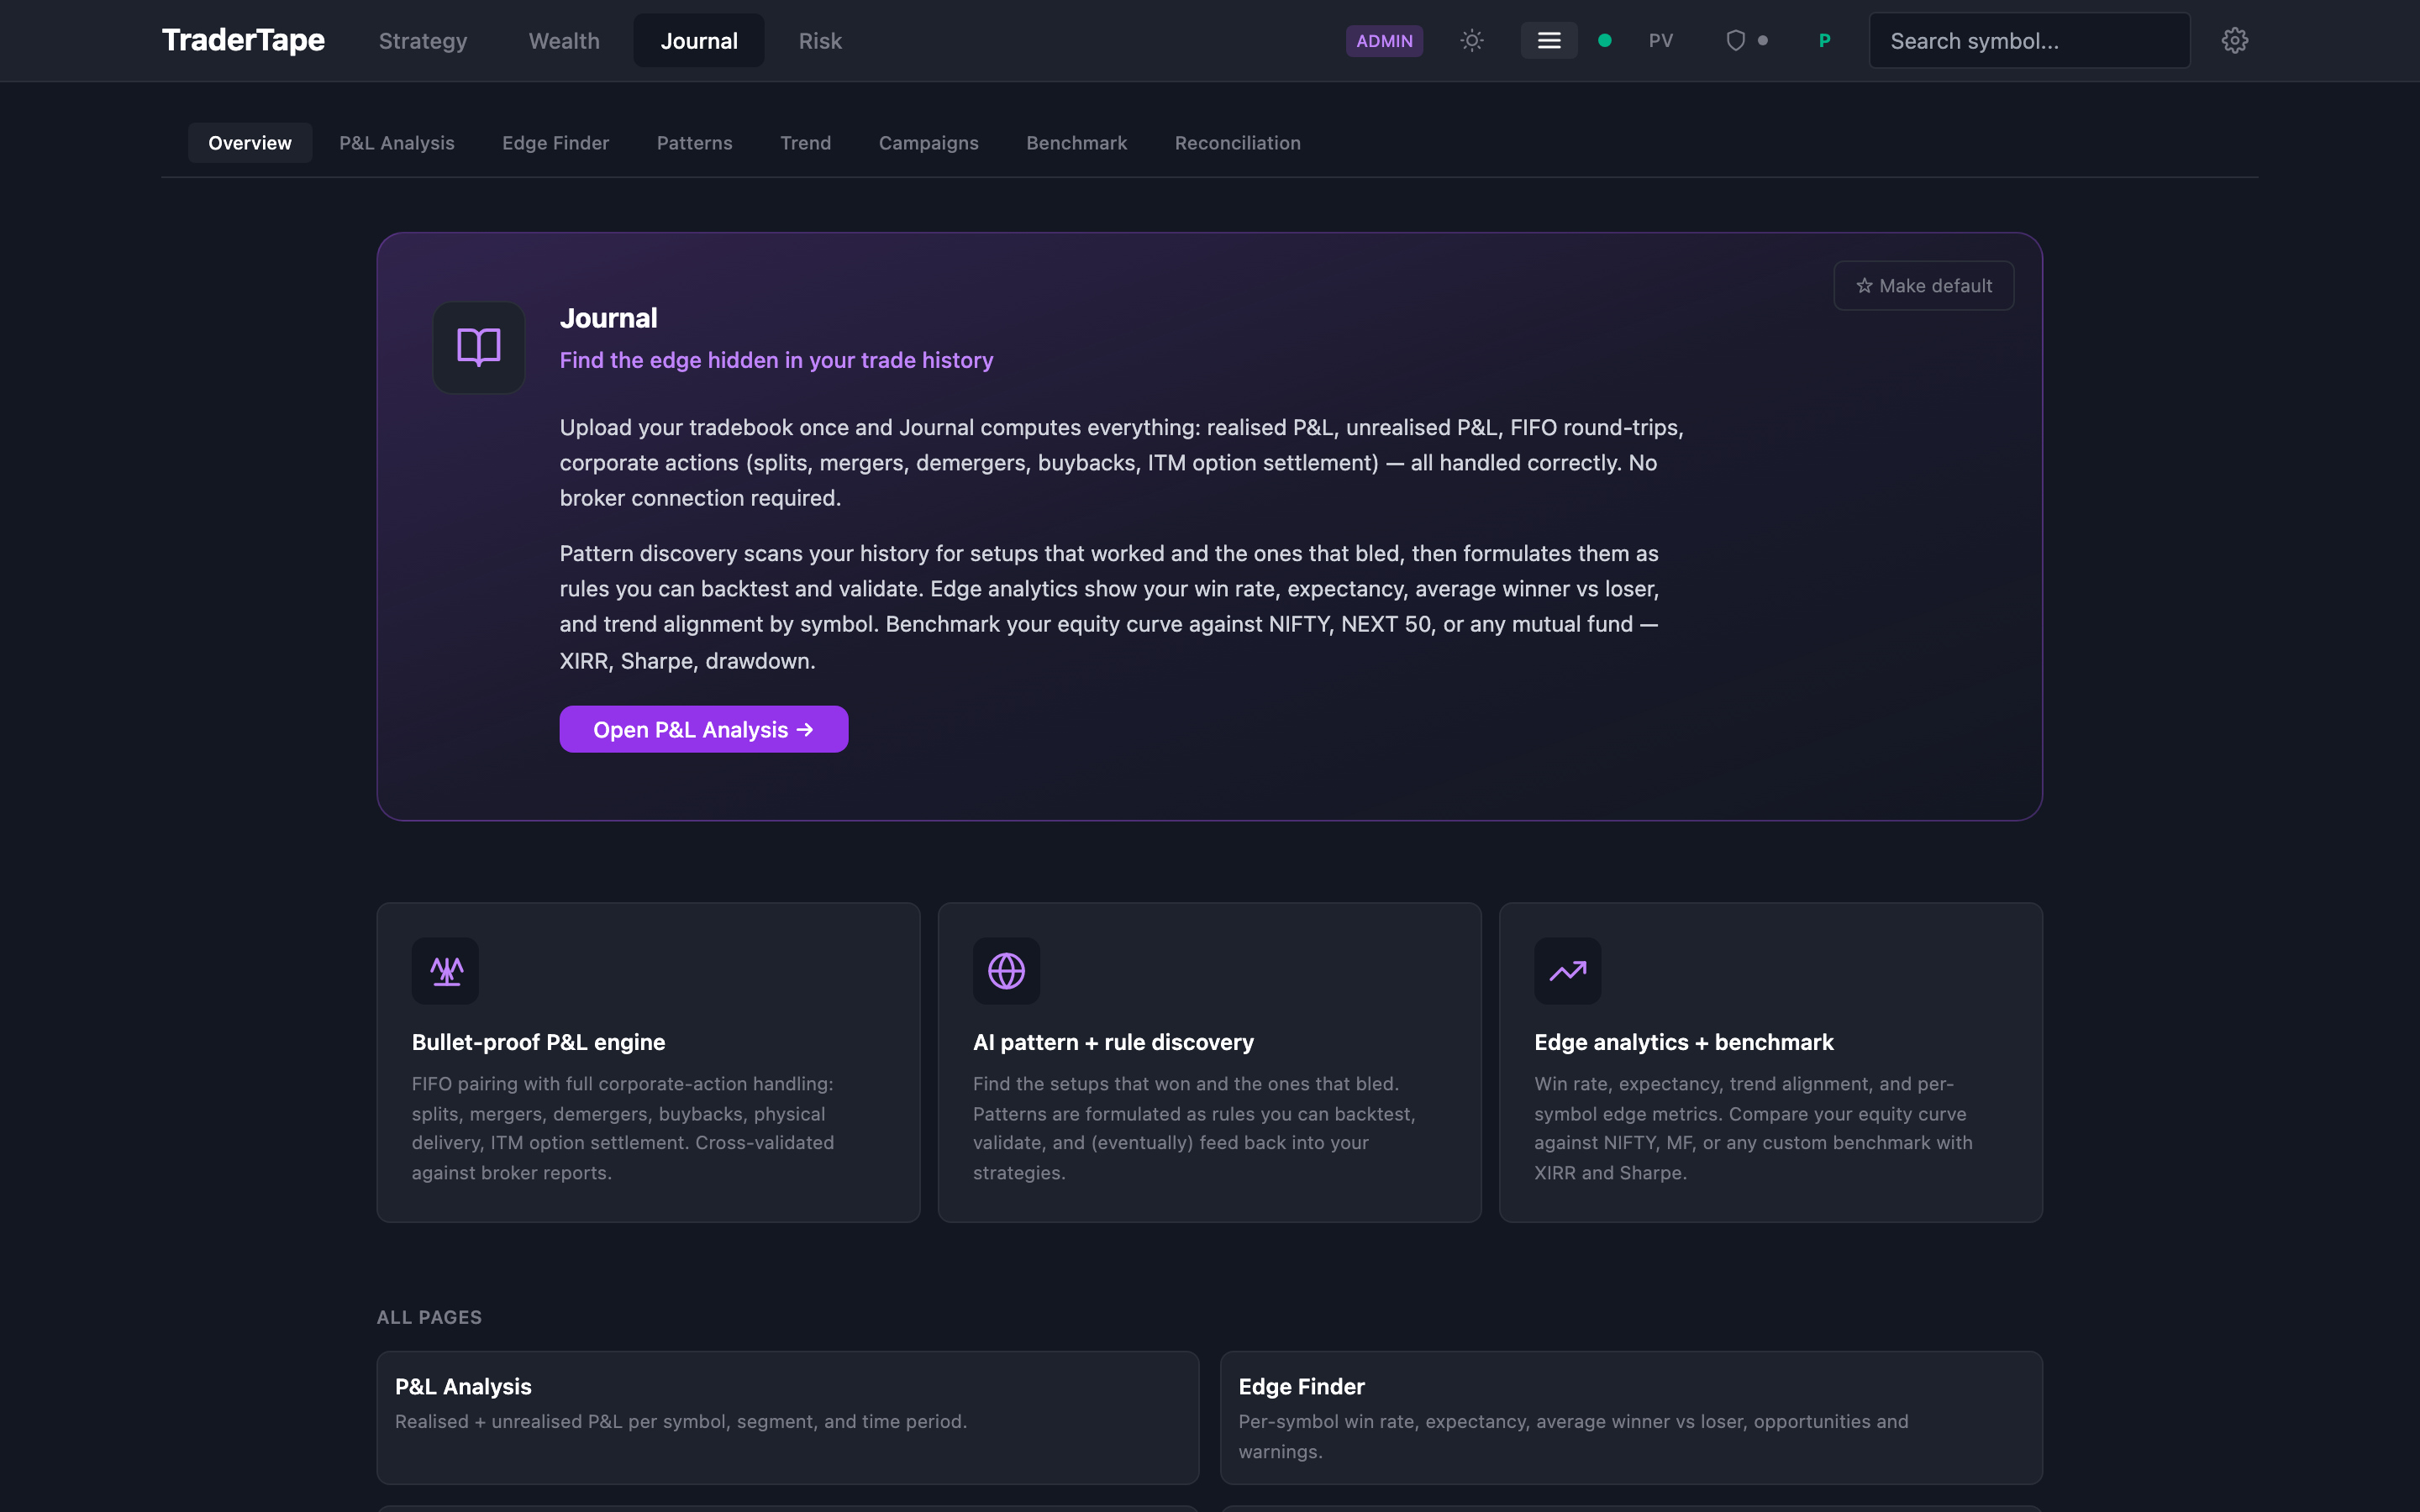
Find the edge hidden in your trade history.
Journal is for retrospective analysis. Upload your tradebook once and it computes everything: realised P&L, unrealised P&L, FIFO round-trips, corporate actions (splits, mergers, demergers, buybacks, ITM option settlement) — all handled correctly. No broker connection required.
What it does
- Bullet-proof P&L engine — FIFO pairing with full corporate-action handling. Handles splits (per-trade rounding fixed), mergers (old → new symbol conversion), demergers (parent cost-basis reduction per Indian tax law §49(2C/2D)), buybacks (off-market tender reconstruction), physical delivery on F&O expiry, ITM option settlement, and more. Cross-validated against Kite's P&L report to within 1-2% (our number is more tax-accurate because we reduce parent cost on demergers).
- Pattern discovery — scan your history for setups that worked vs. bled. The pattern engine formulates findings as rules you can backtest and validate. Key dimensions: trend alignment, volatility regime, RSI zone, holding period, position sizing.
- Edge analytics — per-symbol win rate, expectancy, average winner vs loser, trend alignment breakdown, opportunities, warnings.
- Benchmark — compare your equity curve against NIFTY, NEXT 50, or any mutual fund. XIRR, Sharpe, drawdown, alpha.
When to use it
- You have years of trading history and want to find what's actually working.
- You want to know if you'd have been better off buying NIFTY and doing nothing.
- You suspect you have an edge in specific symbols or setups but want data to confirm it.
- You want to surface behavioural patterns (revenge trading, position sizing creep, holding period distributions).
When NOT to use it
- You don't have tradebook data yet. Journal needs trades to analyse — either upload an XLSX from your broker or let TraderTape sync them from a connected broker.
- You only want live portfolio data. Go to Wealth.
- You want to forecast or deploy new strategies. Use Strategy instead — though insights from Journal can directly inform new strategy rules.
Sub-pages
| Page | What's there |
|---|---|
| P&L Analysis | Realised + unrealised P&L per symbol, segment, time period |
| Edge Finder | Per-symbol win rate, expectancy, trend alignment, opportunities, warnings |
| Patterns | AI-formulated rules from your trade history with mini-backtests for validation |
| Trend | With-trend vs against-trend performance breakdown across symbols |
| Campaigns | Scaling patterns and round-trip groupings — your trading "campaigns" over time |
| Benchmark | Equity curve vs NIFTY / NEXT 50 / MF with XIRR, Sharpe, drawdown |
| Reconciliation | Daily P&L replay and monthly reconciliation against broker P&L reports |
Needs a broker?
No. Journal runs entirely on uploaded data. You can live in Journal for months without connecting a broker.
The only thing you need: a tradebook in one of the supported formats (Kite XLSX, your own format — see Tradebook import).
Setup
- Tradebook import — upload your broker's tradebook XLSX. Re-upload anytime; duplicates are silently skipped.
- Wait a few seconds for the P&L engine to run (it's fast — Kite's 9 years of data processes in under 30 seconds).
- Open P&L Analysis to see your results.
Next steps
- Tradebook import — supported formats, dedup, corporate action handling.
- P&L analysis — how to read the output, common edge cases.
- Patterns & edge — what the pattern engine finds and how to act on it.
- Benchmark — setting up comparisons against indices and mutual funds.