Benchmark
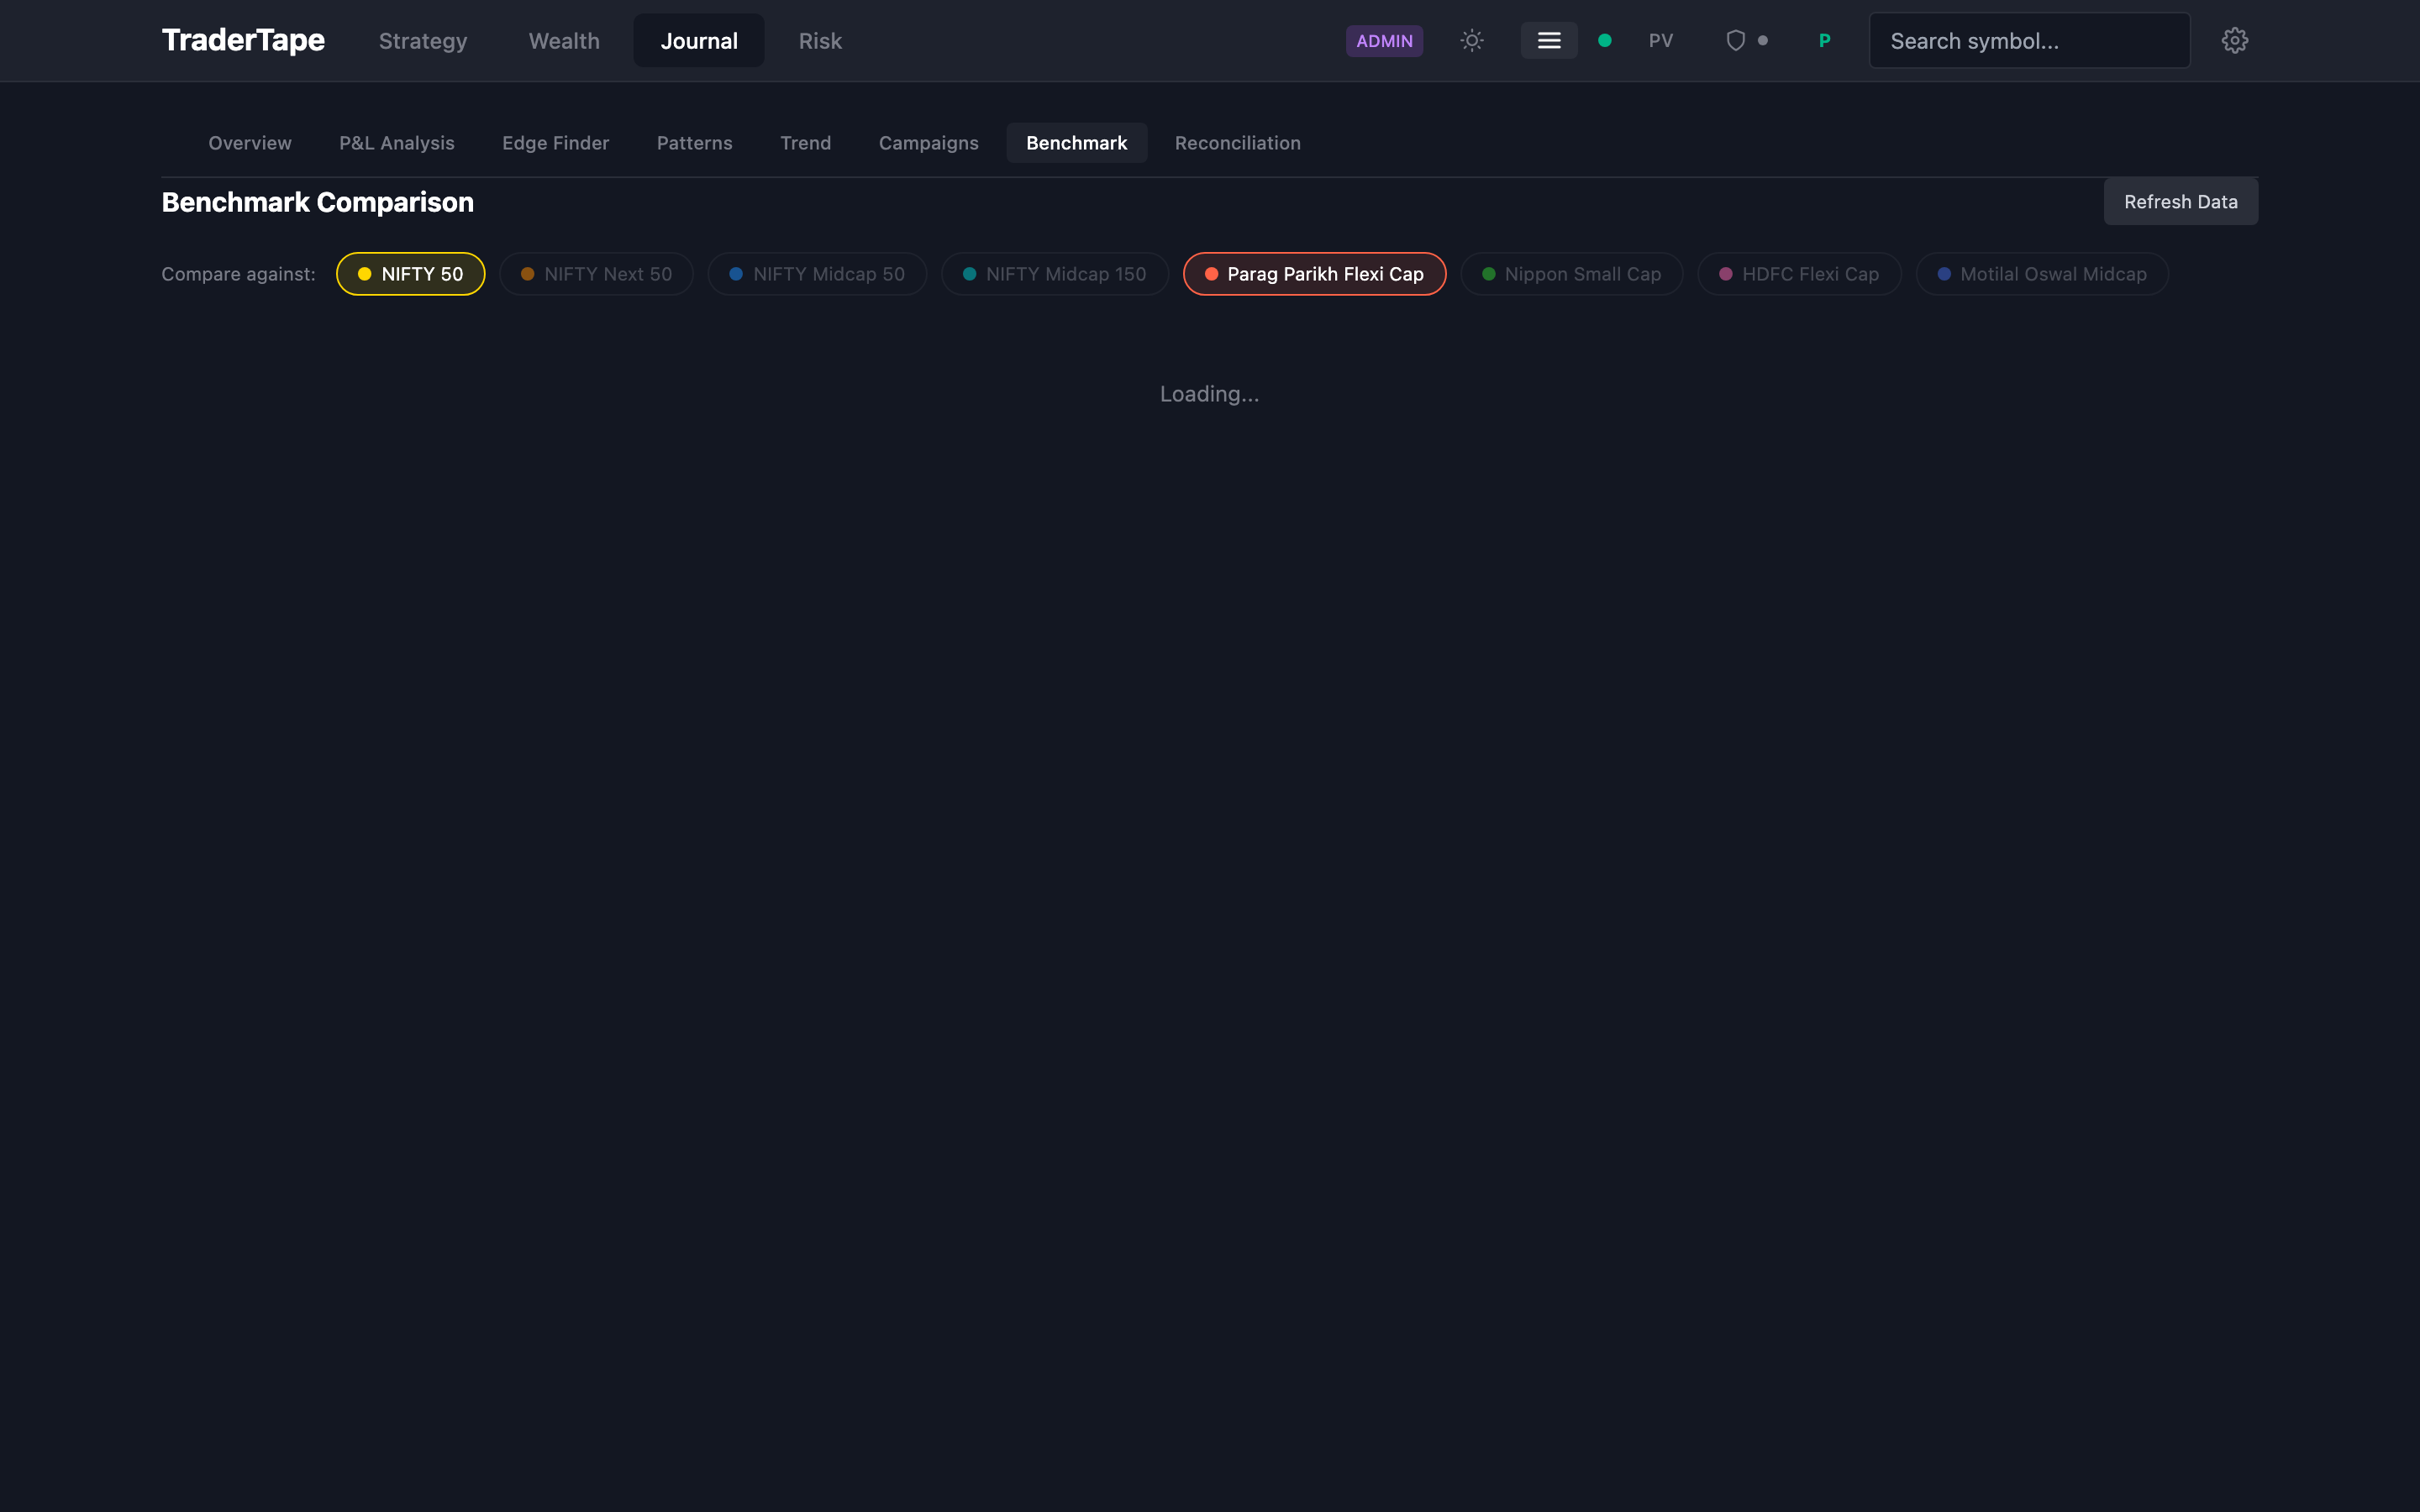
Location: /app/journal/benchmark
Benchmark compares your trading equity curve against a reference — an index, a mutual fund, or a custom benchmark. It answers the question that matters most: would you have been better off just buying the index and doing nothing?
What you see
- Equity curve chart — your cumulative P&L vs the benchmark, normalised to the same starting value on day 1
- Key metrics — CAGR, XIRR, Sharpe ratio, max drawdown, alpha (over benchmark), beta, correlation
- Period selector — all-time, year, 3-year, 5-year
- Benchmark selector — NIFTY 50, NIFTY 100, NIFTY NEXT 50, NIFTY MIDCAP 50, or any mutual fund you've imported via CAS
Methodology
Your equity curve is computed from:
- Trade P&L — realised P&L from
_pair_trades(day-by-day cumulative) - Unrealised mark-to-market — daily mark of open positions using
historical_pricesdata - Capital in/out — from the ledger, detecting fund additions and withdrawals
- XIRR — proper internal rate of return accounting for irregular cash flows
Benchmark equity curve is a simple buy-and-hold simulation: on day 1 you "buy" the index at whatever the day's close was, re-price daily against the index's closing price, no trading friction.
Alpha and beta
- Alpha — the excess return you generated above what beta alone would have predicted. Positive alpha means you beat the market after adjusting for how much market risk you took.
- Beta — how much your returns moved when the benchmark moved. Beta of 1.0 means you move 1:1 with the benchmark. Beta > 1 means you're leveraged exposure; beta < 1 means you're defensive.
Both are computed from daily return series using linear regression of your daily returns against the benchmark's daily returns.
Known caveats
- Survivorship bias — the benchmark uses the current index constituents held constant backward in time. For NIFTY 50, this is close enough (changes are slow). For NEXT 50 / MIDCAP 50, the historical composition matters more and isn't yet corrected in the benchmark path (it IS corrected in the Strategy backtester).
- Dividends — benchmark returns are price-only, not total-return. Your P&L from dividends IS counted (they flow through the ledger). The benchmark is slightly understated as a result.
- Short periods — for periods under 6 months, XIRR and Sharpe are noisy. Treat the numbers as directional only.
- Capital injections/withdrawals — if you deposit or withdraw money during the period, CAGR becomes misleading and XIRR is the right metric. The UI emphasises XIRR for exactly this reason.
Mutual fund benchmarks
If you've uploaded a CAS PDF (see Mutual funds & CAS), every scheme in your CAS becomes a possible benchmark. Useful for answering "would I have been better off just holding this MF instead of stock-picking?"
The scheme's NAV history comes from AMFI's free feed (cached in mf_nav_history).
Prerequisites
- Tradebook data
- Historical daily candles for your traded symbols (for mark-to-market)
- Benchmark NAV history (fetched automatically for indices; requires CAS upload for MFs)
Related
- P&L analysis — the underlying P&L this chart builds on
- Tradebook import — getting trades in
- Mutual funds & CAS — importing MF schemes as benchmarks